

Project management and process optimisation
Projects and processes as they really run. Not as they read in the handbook
TESS documents, monitors, runs and analyses business processes.
Processes, dashboard and Process Orb can be viewed live at any time. Instead of reading a report once a month, you see where things stand right now. Project management and quality management come on top as areas of their own.
Hosted in Germany
Six sentences
If you have your processes automated, you want to know whether they run
Not once a month, but now. We hear these six sentences a lot before a project starts.
“We automated, but we cannot see whether it runs.”
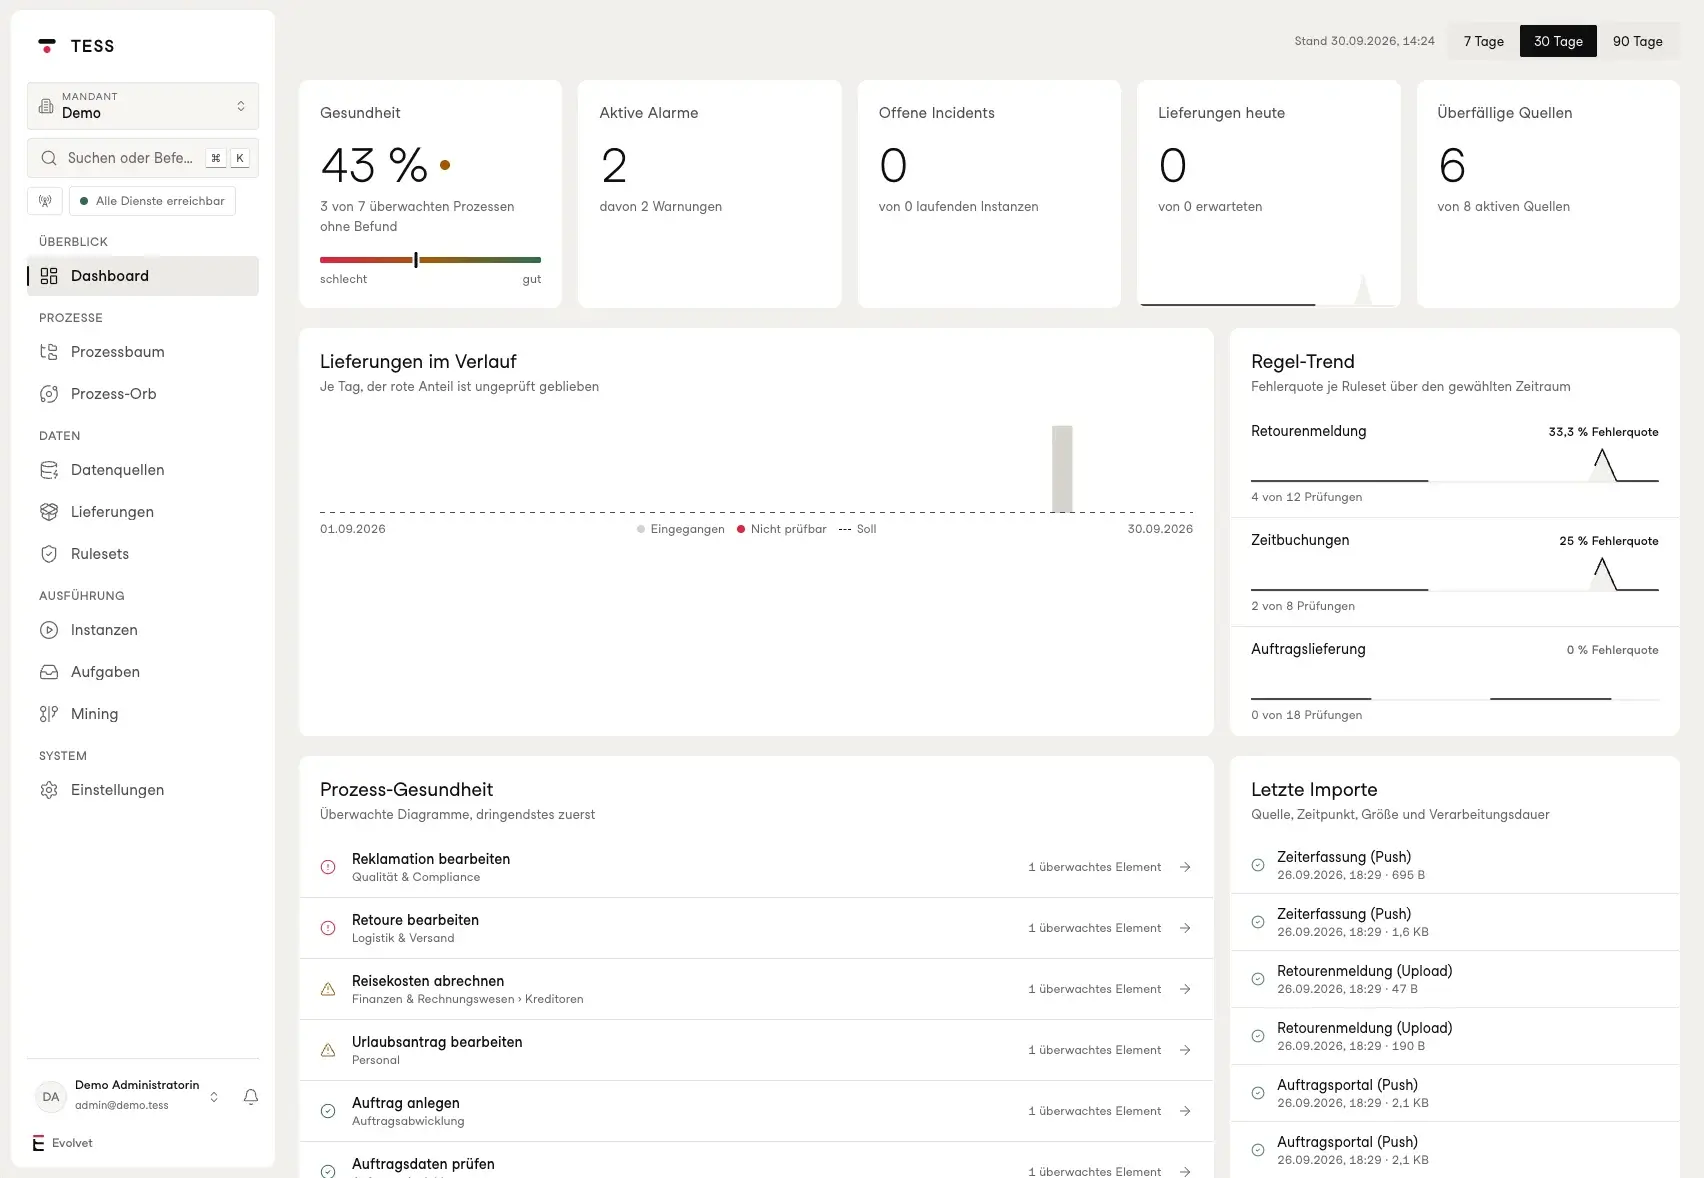
The dashboard shows the health of your processes, active alerts and open incidents. At any time, without having to ask.
“A delivery does not arrive, and nobody notices.”
TESS checks every data delivery against fixed rules. Overdue sources stand out straight away, not at month-end closing.
“Our process documentation stopped being accurate ages ago.”
In TESS, processes are documented as BPMN diagrams. The documentation lives where the monitoring happens, so it stays current.
“Which process is actually causing the most trouble?”
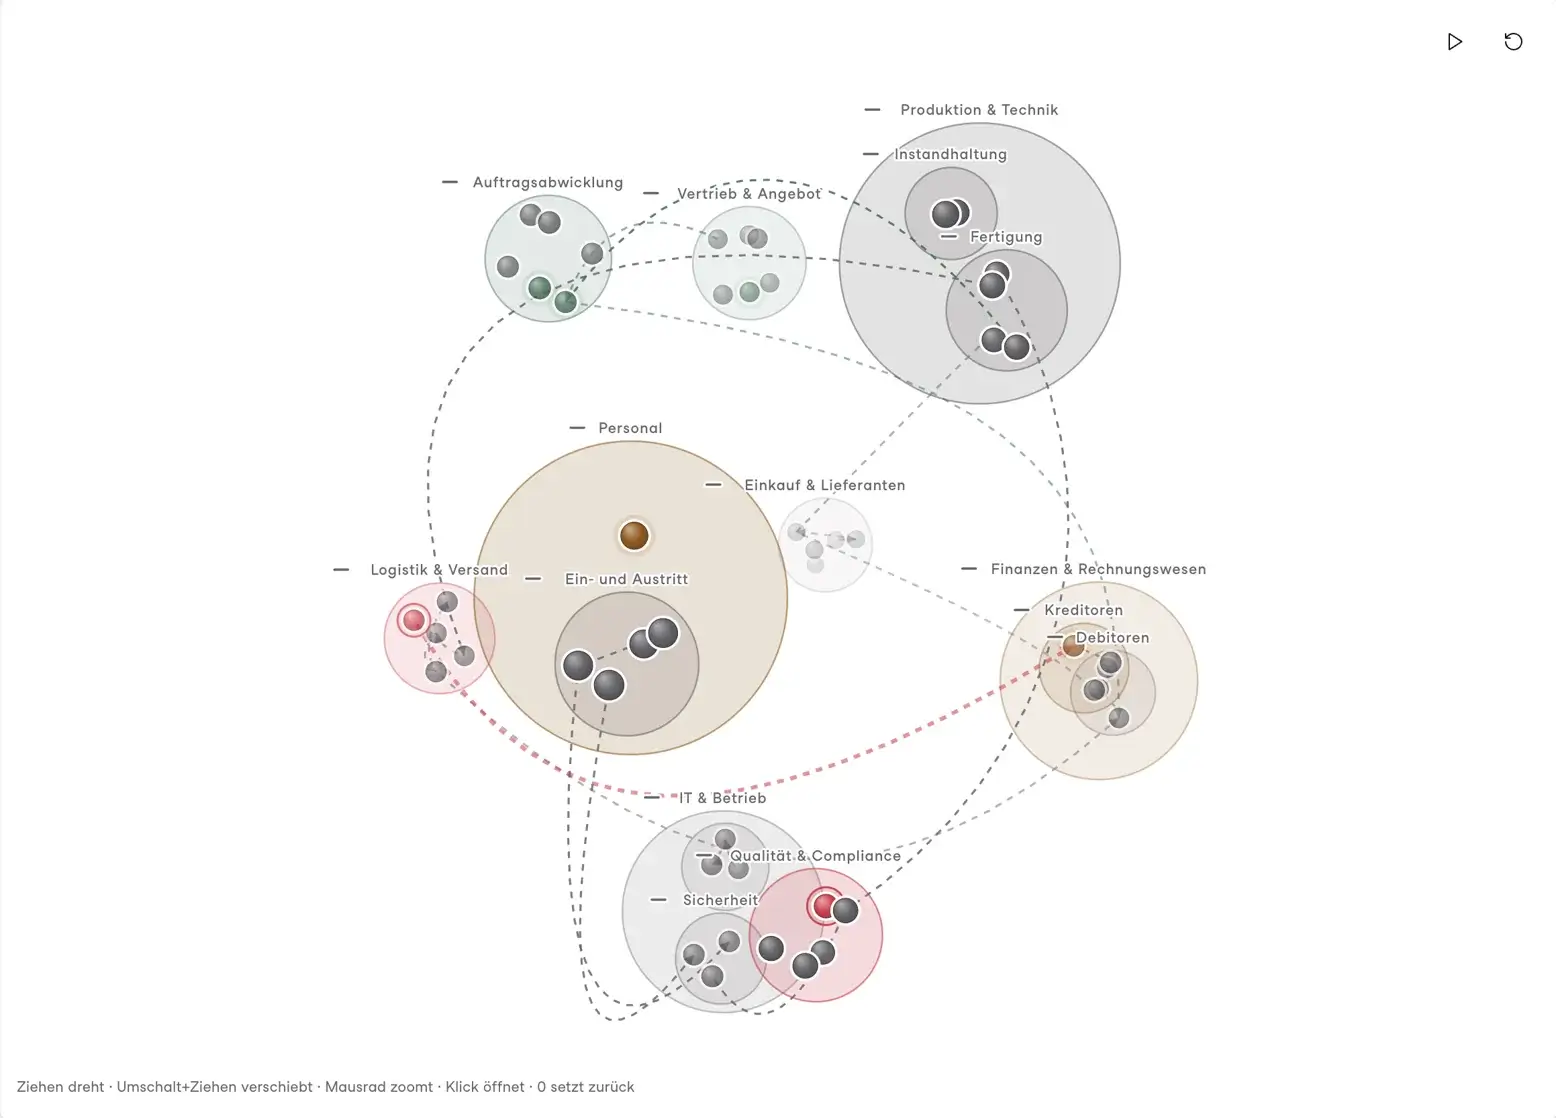
The Process Orb shows your company as a planetary system. Whatever raises an alert glows red. The list puts the most urgent at the top.
“Our service provider sends a PDF once a month.”
With your own login you see the same status we do, live, without waiting for the next report.
“What exactly was delivered?”
TESS keeps every original file byte for byte. When something arrived, how large it was and how it was checked can be traced.
How it works
From workflow to insight, in four steps
- 1
Capture
Processes are recorded and modelled as BPMN diagrams, organised by area such as sales, logistics or finance.
- 2
Connect
Data sources are connected via API or FTP. Every delivery has rules: what has to arrive when, and what it should look like.
- 3
Monitor
TESS checks every delivery and every monitored process. When something deviates, TESS raises an alert.
- 4
Insight
Processes, dashboard and Process Orb always show the current status.
Dashboard
The dashboard answers the key questions at a glance. How healthy are the monitored processes? Are there alerts or open incidents? Have today’s deliveries arrived, and which sources are overdue? You choose the time range, from seven to ninety days.
- Health
- Share of processes without findings
- Alerts
- Active alerts and warnings
- Deliveries
- Received today and expected
- Sources
- Overdue data sources
Process Orb
The Process Orb shows every process as a sphere, grouped by area such as order handling, HR or finance. Connections show which processes belong together. Red means alert, yellow warning, green all clear.
- Overview
- All processes, grouped by area
- Relationships
- Connections between processes
- Status
- Alert, warning, all clear, not monitored
- Controls
- Rotate, zoom, open with a click
Process health
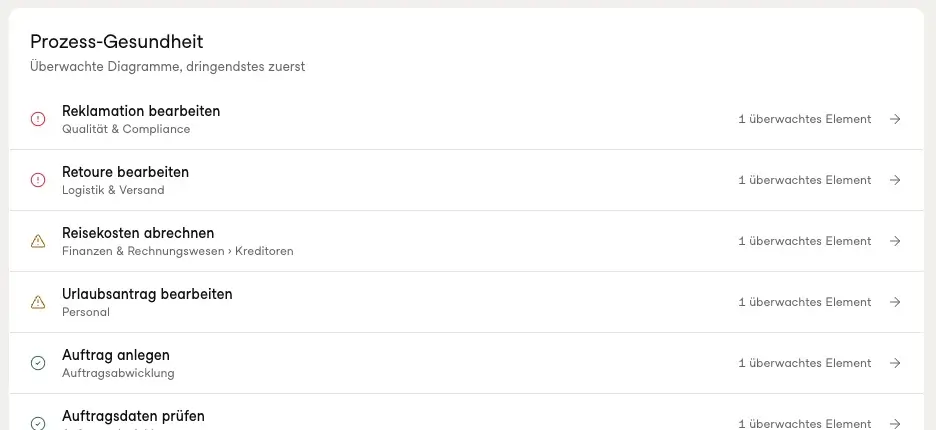
Behind every point in the Orb there is a documented process. Process health lists the monitored diagrams, most urgent first. One click takes you to the BPMN diagram, so you can see where in the workflow the deviation sits.
- Documentation
- BPMN diagrams per area
- Order
- Most urgent first
- Monitoring
- Down to single elements in the workflow
Rules and archive
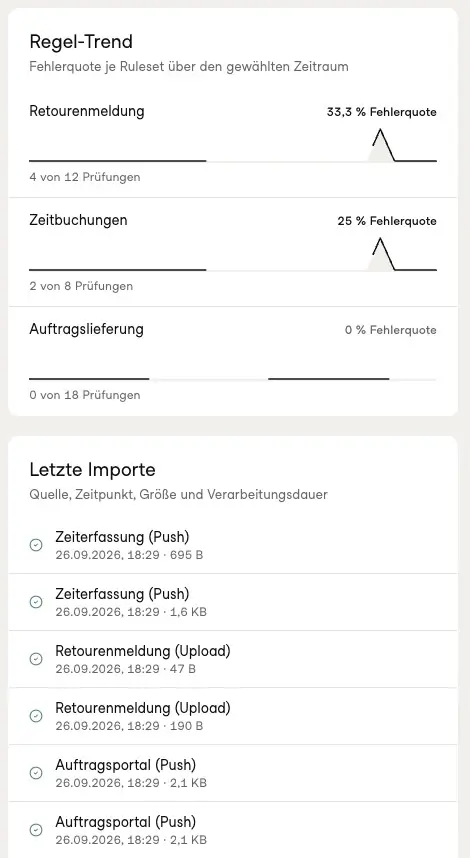
Every data delivery is checked against rules. The rule trend shows how often a check fails, and the latest imports show source, time and size. Originals stay archived byte for byte for as long as agreed for each source.
- Rules
- Failure rate per ruleset over time
- Imports
- Source, time, size, duration
- Archive
- Originals byte for byte, retention per source
Areas
Three areas, one platform
Process mining
See what really runs
Variants and deviations from real data, next to the BPMN documentation and the rules for every delivery.
Project management
Plan and record
Project planning, tasks, time tracking and absences. Who is working on what, and who is away, is in one place.
Quality management
Evidence from everyday work
Controlled documents, approvals, nonconformities, audits and risks. That helps you earn and keep ISO 9001 certification, with evidence from day-to-day operations.
Control
Process data is confidential. That is why it is clearly defined who sees what and where TESS runs
Tenants
Your own space
Every client is its own tenant with a separate database. You cannot see other clients’ data, and they cannot see yours.
Access
Clear permissions
Roles are assigned per area. It is defined who may change processes, projects or documents.
Archive
Originals are kept
Delivered files are archived byte for byte. How long is set for each data source.
Hosted in Germany
Run at IONOS
TESS runs on IONOS servers in Germany.
Working together
TESS works on its own. And even better with the other platforms
 OSKAR
 EVI
 NEVA
Questions
What people often ask
Where does TESS get its data from?
From your systems, via API or FTP drops. Which sources are connected is agreed at the start.
What happens when TESS finds a deviation?
TESS raises an alert. The status is visible at any time in the dashboard and in the Process Orb.
Can other clients see our data?
No. Every client is its own tenant with a separate database. Other clients do not see your data, and you do not see theirs.
Does TESS help with ISO 9001 certification?
Yes. Quality management handles controlled documents, approvals, nonconformities, audits and risks, and the evidence builds up in day-to-day operations. The certificate itself is still issued by an accredited body.
How long are delivered files kept?
That is set for each data source. Until then, every file is kept as the original, byte for byte.
Trust is good. Being able to look inside is better

“A process that is only right in the handbook is not right. We built TESS so you can see whether it holds up in day-to-day work.”